Skip to main content
SUPPORT / RESISTANCE AREAS
SUPPORT / RESISTANCE AREAS
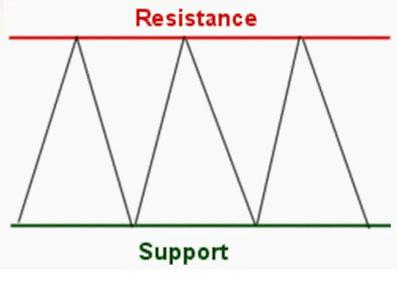
- Support (Demand): This is an area where buyers are likely going to overwhelm sellers causing the market to go up. When a market falls down to a prior low, it is more significant than when a market falls down to a prior high.
- Resistance (Supply): This is an area where sellers are likely going to overwhelm buyers, causing the market to go down. When a market trades up to a prior high, it is more significant than when a market trades up a prior low.
- Support can become resistance and resistance can become support if prices break through these areas.
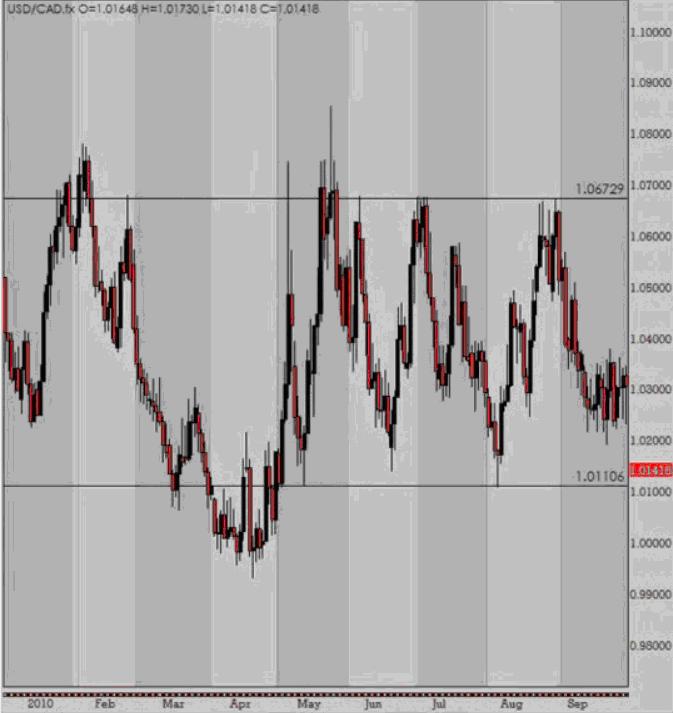
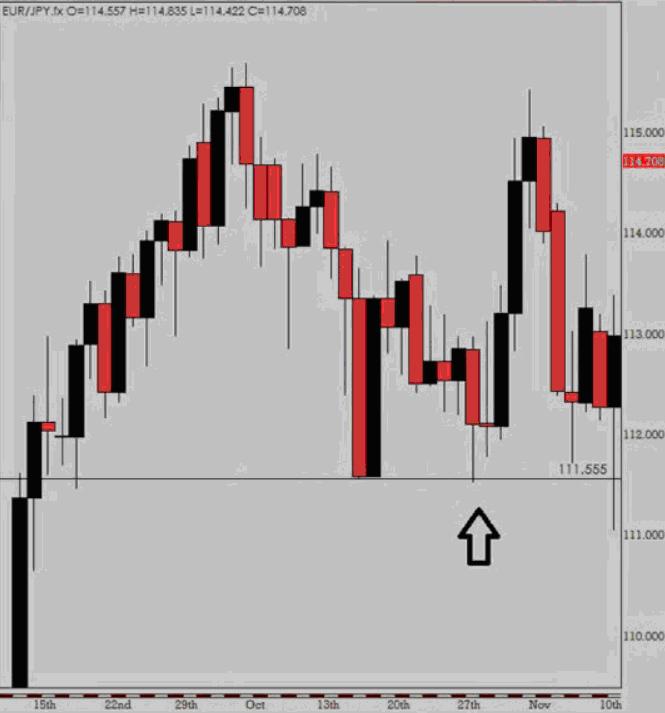
- Confluence of S&R areas is a key concept to the trade entry. The listings below are considered key S&R areas to consider for confluence. There is no right or wrong confluence setup, the more confluence you have the higher the probability the trade outcome. The easiest way to find Key levels to anticipate reactions in the future is to begin with the long term charts and work your way down to the lowest timeframe you intend to trade from.
Natural S&R Levels
- High / Lows based off: 12 months rolling; Quarterly; Monthly; Weekly; Daily; 4hr
- Monthly Charts - Note the highs the market turned at and the lows the market turned at. These levels are the obvious levels that any quick glance would reveal. Do not strain your eyes and waste time wondering if a specific level is a Key level... it is because it is obvious. These market turning points are obvious... do not over think them.
- Weekly Charts - The long term Monthly Key S&R levels will appear on these charts as well as new Key Levels the Monthly timeframe was not so apparent to see.
- Daily Charts - This is where the banks work from. All the longer term Monthly and Weekly S&R levels are to be plotted on this Daily time frame. The Daily chart will present its own Key S&R levels and these need noting as well.

- Intraday Time Periods (4-hour, 1-hour, and 15min) - These will show excellent reaction levels to anticipate trades to set up on far in the future and this is the key to proper trade selection and developing patience. Note the Key S&R levels on your individual intraday charts you like to use.
- Session Highs and Lows (Asia most important)
- Asian Session sets the parameters for the following London session
- Begins: 7pm EST or 12am GMT
- Ends: 4am EST or 9am GMT
- Allow up to 1 hour before and after these times
- London Session sets the parameters for the following New York session
- Begins: 3am EST or 8am GMT
- Ends: 12pm EST or 5pm GMT
- Allow up to 1 hour before and after these times
- New York Session sets the parameters for the following new trading session’s trading
- Begins: 8am EST or 1pm GMT
- Ends: 5pm EST or 10pm GMT
- Allow up to 1 hour before and after these times
- Intraday Fractal (money flow and ITL or ITH) - Use the 15 minute as a go to chart for monitoring short term swings for lower risk entries and fine tuning stop placement on open positions.
- Trend Line Analysis (channels, obvious trends)
- Implied S&R Levels
- Fib Levels
- Pivot Points
- Monthly Pivots
- Weekly Pivots
- Daily Pivots
- Other S&R Levels
- Institutional Price Levels (IPL) - Institutional Traders may determine timing of trades around 100 pip price levels (0.20, 0.50, 0.80, etc.)
- Trading to a prior low or high
- Daily ADR high/low
KEY POINTS:
- The more times a support and resistance area is “hit”, the more significant it is.
- Only the most recent Swing High / Low are utilized for determining Market Flow with old Swings disregarded.