Skip to main content
PROFESSIONALS USE OF INDICATORS
PROFESSIONALS USE OF INDICATORS
- Revisiting the Market Profiles
- Consolidation Range Profile
- Breakout - Valid & False Profile
- Trending Profile
- Reversal Profile
- Overbought & Oversold
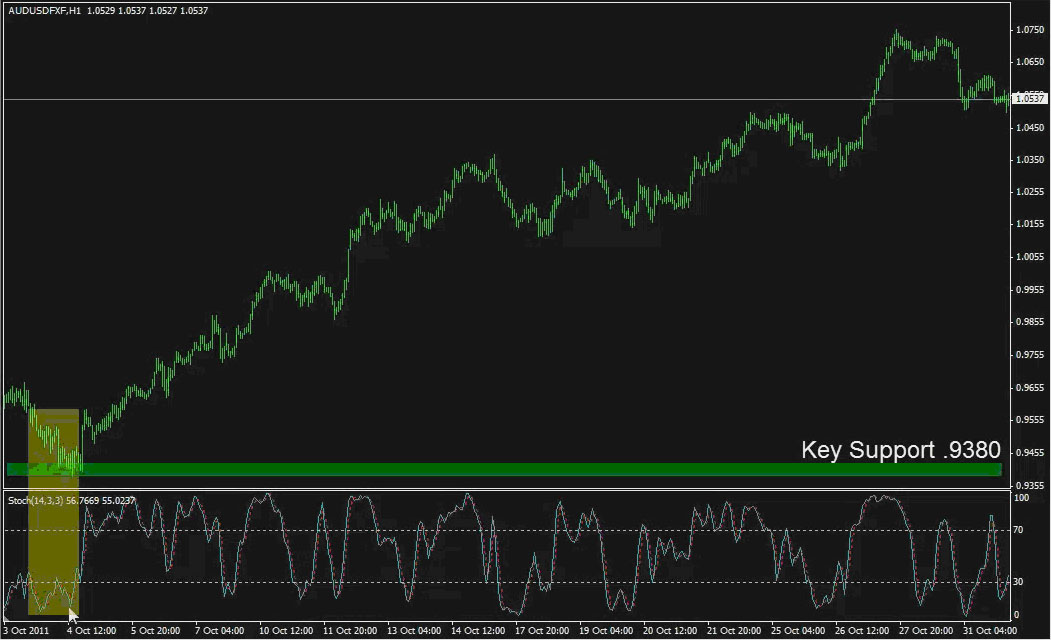
- Focus on Oversold in Market Profiles that suggest prices are bullish is Optimal
- Overbought in Market Profiles that suggest Prices are Bearish is Optimal.
- Stoch(14,3,3) that says we're oversold. We'd expect to see a price rise. Other examples of overbought and we'd expect to see a price fall.
- False Signals - Overbought signals were no longer suggestive of price movements because price traded off of a higher time frame support level.
- Price Divergence - Classic use with indicators is to look for Divergence between price and the indicator. Price reaches new low but indicator does not reach a new low. This is a divergence between price and indicator.
- Type 1 Divergence (Reversal in Nature) - Price moves opposite the higher time frame trend and diverges with indicator. Price moves opposite the higher time frame trend and diverges with indicator because it is a sign of a reversal by nature.
- Bullish Type 1 Divergence: Price finds a lower low while the indicator finds a higher high for the same period
- Bearish Type 1 Divergence: Price finds a high high while the indicator finds a lower low for the same period.
- Type 2 Trend Following Divergence - Divergence from indicator when price follows the trend but diverges with indicator.
- Bullish Type 2 Divergence: Price finds a higher low while the indicator finds a lower low for the same period
- Bearish Type 2 Divergence: Price finds a lower high while the indicator finds a higher high for the same period.