ICT TRADING CONCEPTS
The Trader's Trinity - Inner Circle Trader's Exclusive Overbought - Oversold & S&R Concept - Day 11
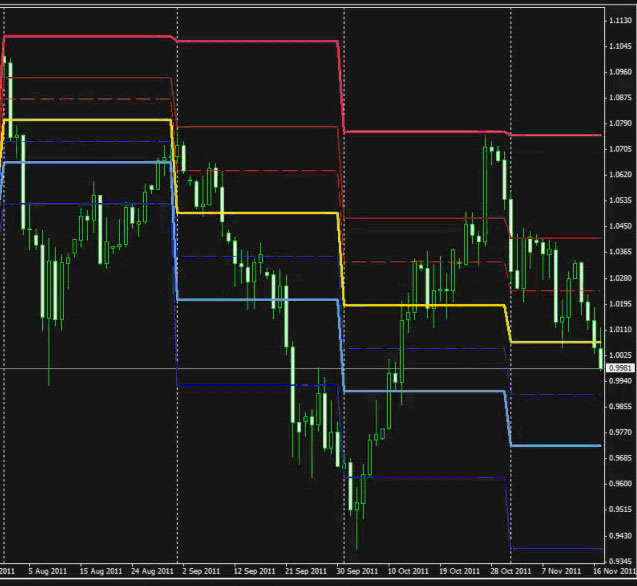
- Trader’s Trinity
- Upper Portion - Overbought zone. Look for shorts.
- Middle of the Range - Fair value / Equilibrium
- Lower Portion - Oversold Zone. Look for buys.
- Monthly Trinity
- Look for periods where price has broken out of the Trinity Range to the low and high using the daily chart as sectioned off by Monthly Trinity.
- Reference the 3 previous periods in the time frame to look back for relevant levels/information.
- Trinity Levels
- Upper boundary price levels would signify an overbought area and we should look for opportunities to sell.
- Lower boundary price levels would signify an oversold area and we should look for opportunities to buy.
- Always see if this is in agreement or against higher time frame analysis.
- Price will typically come back to the fair value zones in the center area of the Traders Trinity. Try not to trade in the Fair Value Zone.
- Broken Trinity
- Whenever seeing a broken Trinity, prepare the likelihood of a major high or low forming in the marketplace.
- When price breaks out above the Trinity, use Fib by taking high of Trinity and bring down to the low. When breaking to the low, use Fib by taking low and bring down to the low. The two levels to focus on are the 162 and 200 extension. These two levels will usually have a reaction or correction to be used to get targets.
- Look for correction at the breakout high/low point.
- 162 and 200 Extension - These levels should hold true as targets until they are reached. If price does not reach these levels and pulls away, you may think that the levels are not valid any longer but they tend to still hold true in the longer time frame.
- Previous Week Traders Trinity - Same premise as Monthly Trinity. Identify areas where price breaks out of the Trinity to the Low or High. Use Fib to project 162 and 200 extension levels to estimate where price may go.
Trading Smart Money Correlation Concepts - Day 12:
Smart money actions get revealed through cracks in the market. They leave fingerprints as they switch the tide of the current price swing. When the correlation materializes at predetermined support & resistance levels we can be confident a reaction will unfold.
- USDX SMT Divergence: Given inverse correlation of pairs, when price on one has lower lows, it is expected that the other should reach higher highs. When this does not occur, we have SMT Divergence. This is suggestive of major accumulation/consolidation in advance of a major move in the opposite direction.

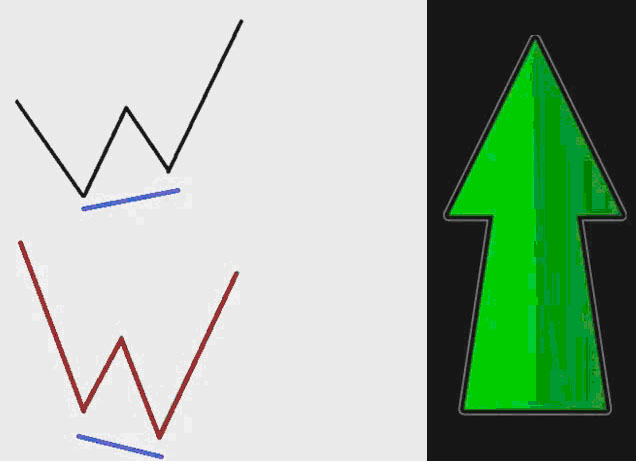
- Correlated Pair SMT Bullish Divergence: Should occur at and confirm predetermined Support Levels. If one pair fails to make a lower low while the other succeeds, then expect both pairs to shoot higher at a key support level.
- When looking at Support plays or "buys" - consider the pair that fails to make the lower low respectively. Premise behind this: The pair that fails to drop lower, it is being bought and hence, not willing to go lower... this is essentially "Demand in Operation"... anticipate Higher prices.
- EUR/USD is making higher lows while GBP/USD is making lower lows > Buy EUR/USD
- Correlated Pair SMT Bearish Divergence: Should occur at and confirm predetermined Resistance Levels. If one pair fails to make a higher high while the other succeeds, then expect both pairs to shoot lower at a key support level.
- When looking at Resistance plays or "sells" - consider the pair that fails to make the higher highs respectively. Premise behind this: The pair that fails to rally higher, it is being sold and hence, not willing to go higher... this is essentially "Supply in Operation"... anticipate Lower prices.
- EUR/USD is making higher highs while GBP/USD is making lower highs > Sell GBP/USD

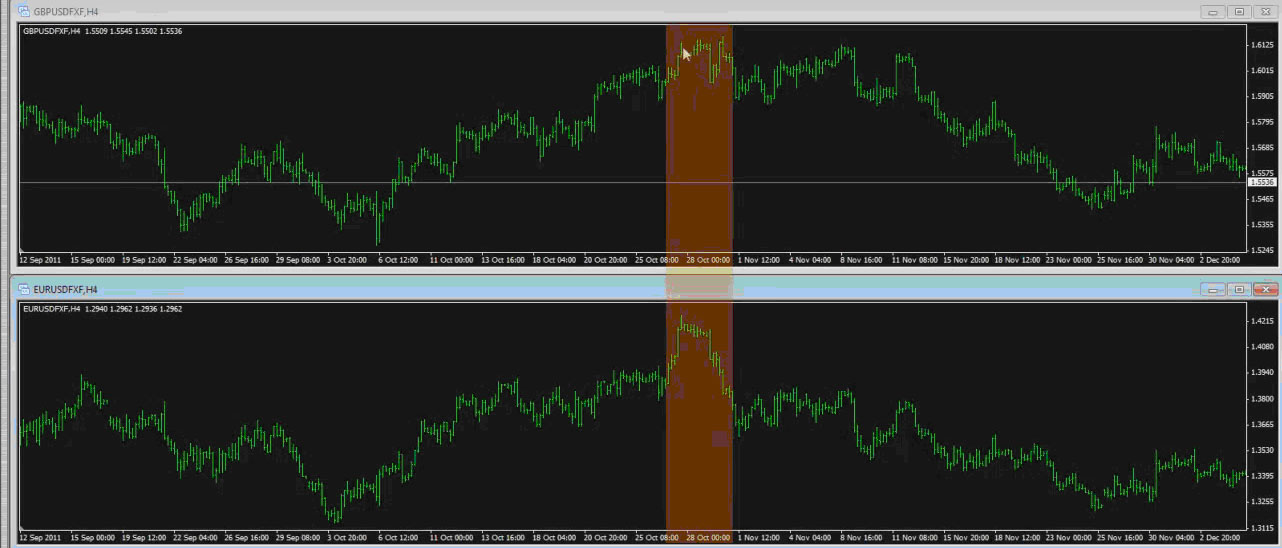
- Real Example of Correlated Pair SMT Divergence (GBP/USD vs. EUR/USD): GBP made a higher high while EUR failed to make higher highs. This signaled a reversal for both pairs.
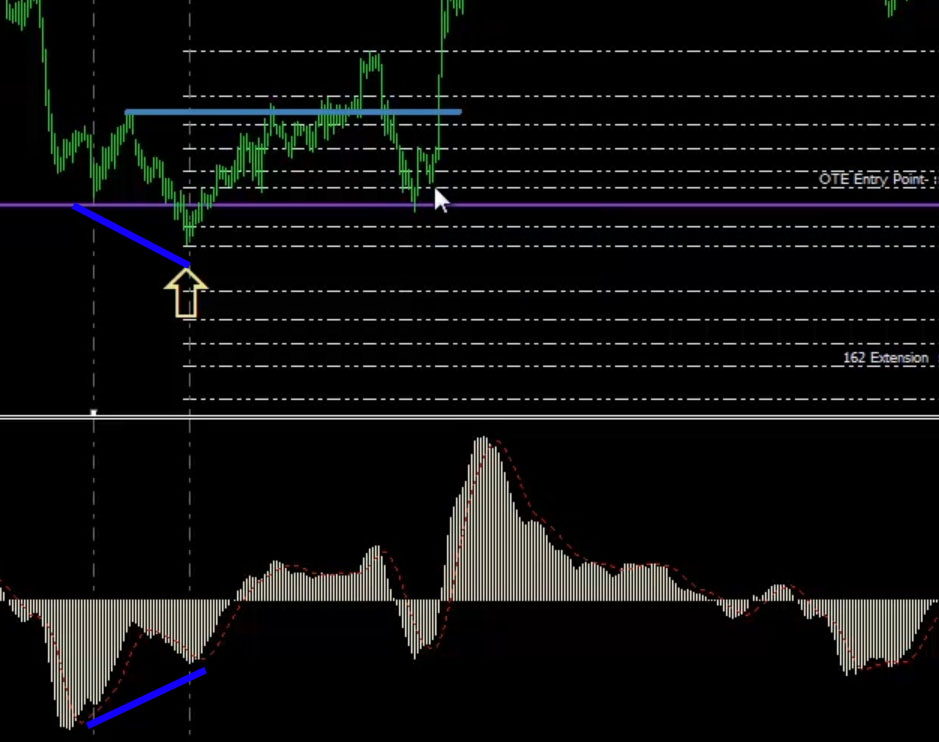
Trading Accumulation / Distribution
- Opportunities to trade Accumulation / Distribution indicator occur when price diverges with the direction of the indicator and is supported by the overbought/oversold Williams %R (10 period) indicator.
- Bullish / Long Setup
- Price makes a lower low.
- Accum / Distr for same period makes a higher low
- Williams %R is in oversold zone
- Given time and price action, find opportunity to go long

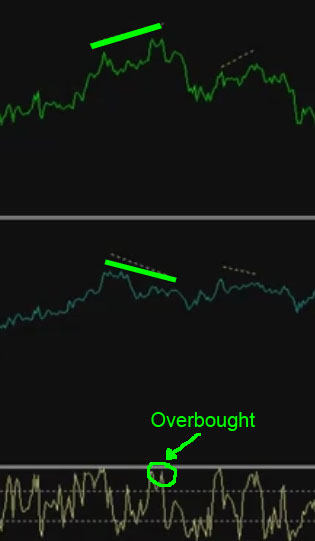
- Bearish / Short Setup
- Price makes a higher high
- Accum / Dist for same period makes a lower high
- Williams %R is in overbought zone
- Given time and price action, find opportunity to go short
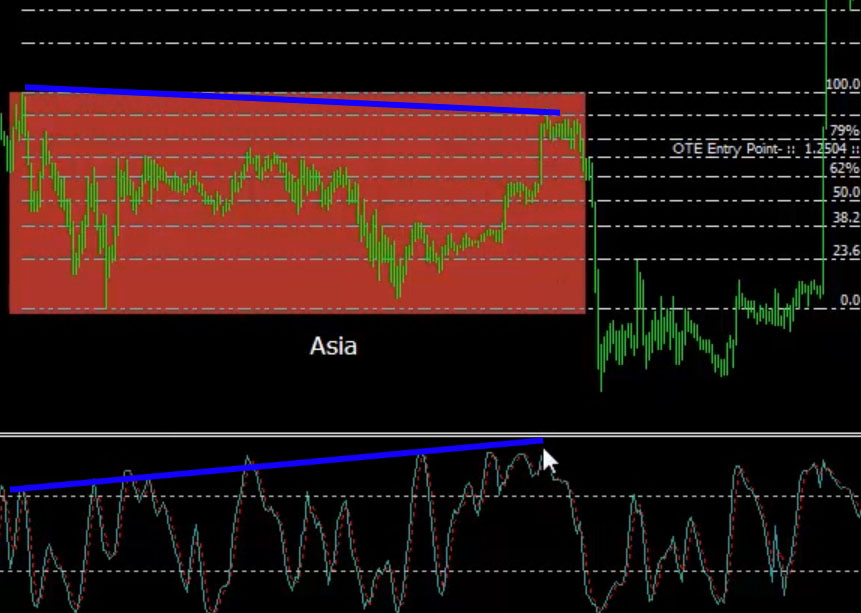
MACD Divergence
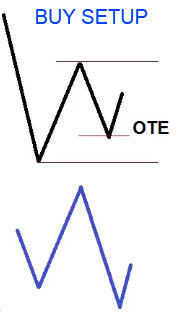
- Type 1 Bullish Divergence - Price meets a lower low while the MACD reaches a higher low. Draw Fib from the swing low where the divergence was established to the recent swing high and look for OTE to enter long.
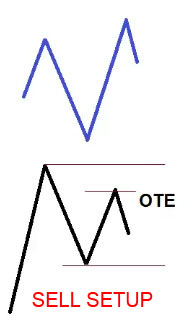
- Type 1 Bearish Divergence - Price meets a higher high while the MACD reaches a lower high. Draw Fib from the swing high where the divergence was established to the recent swing low and look for OTE to go short.

ICT Grail (Market Review 7/15 ~32min)
The ICT Grail forms at the OTE when there is a Type 2 Trend Following Divergence of price vs. the Stochastic Oscillator. Oscillator setting is %K @ 10, %D @ 3, Slowing @ 3.
- Buy Setup - Price finds a higher low at the OTE level. For the same period, the indicator finds a lower or equal low at the same time.

- Sell Setup - Price finds a lower high at the OTE level. For the same period, the indicator finds a higher or equal high at the same time.
ICT Stinger (Day 15 Notes ~20:30)
Type 1 and 2 Combined (STINGER) Over a period, price moves with the high time frame trend but diverges with the indicator. This combined with a smaller period where price moves against trend and diverges with indicator. Very powerful indication of price taking off.
- Type 1 - Lower low in price but a higher low in the stochastic (yellow lines in chart)
- Type 2 - Trend following divergence a higher low in price but lower reading in the stochastic (green lines in chart)
- Most powerful when this occurs at key support and resistance levels and OTE.

Interest Rate Yield Triad (Market Review 7/29) 26:15
- US 10 year yield vs two correlated country’s 10 year bond yields.
- Rising yields means rallying price (rising) as the higher yields draw attraction to the currency.
- Look for divergence among the correlated currencies and the US bond yield
- The yield that was unwilling to go lower vs. the other two yields, identifies the currency which will be attempting to go higher.
- When one currency goes higher, it should affect the other correlated currency in the same manner.
