DOJI
- Doji are important candlesticks that provide information on their own. They form when an asset's open and close are virtually equal.
- Alone, doji are neutral patterns. Any bullish or bearish bias is based on preceding price action and future confirmation. They are best seen at the end of a price swing or trend.
HAMMER
- Hammer candlesticks form when a security moves significantly lower after the open, but rallies to close well above the intraday low. The resulting candlestick looks like a square lollipop with a long stick.
- If this candlestick forms during an advance, then it is called a "hanging man." A hanging man is bearish.
- If price was going down before it forms, then it is a bullish signal, expect a reversal.
- We like to see the red candle at a high going into a key resistance level where we are anticipating a sell.
- These patterns are good to see at key support & resistance levels as well as optimal trade entry areas.
- They can provide confirmation of a trade that we are already in.
- You can also refer to this pattern after the fact as well, to establish a late entry in sync with the current market flow and/or direction.
- Below is an image of 2 different hammers:
- Doji's during a news event are an indication that smart money has tipped their hand and you can trade them after the fact.
TWEEZER
- The tweezer pattern indicates that prices held twice at the exact same level.
- At the lows, sellers were not able to push the asset lower. This is a good pattern on the 4 hour and 1 hour charts at higher time frame S/R levels. If it accompanies an SMT divergence then you should trade maximum risk exposure on that alone.
- It is a solid confirmation that a significant low is priced in.
- Reverse this for tweezer tops.
RAILROAD TRACKS
- The railway track is one of the best reversal candlestick patterns you can discover on a chart.
- It actually signifies that the market makers have engineered a reversal. The fact that the asset quickly reverses direction and posts an equally if not larger subsequent candlestick is enormous insight.
- The 2 best candlesticks out there are hammers and railroad tracks. They are strong and reliable. When they form at key levels.. there's nothing easier to trade than that.
HEAD & SHOULDERS
- The head & shoulders formation is typically found at an intermediate term high or low or a long term high or low.
- High probability trade setups are at intermediate term highs and lows.
- The example of a head & shoulders top below is on an hourly chart:
- Once the neckline has been broken, to get a reasonable price objective you can measure the high of the head to the neck line and add that from the neckline down in the example below:
- You can also do it by using the swing low before the one that is a part of the neck line. This will give you a further target to shoot for:
THREE INDIANS CLIMAX REVERSAL
The Three Indians Climax Reversal is also on the hourly chart below:
- You want to see 3 strong drives higher into an area of resistance. Divergence can be used along with this pattern. You can look for an optimal trade entry short on a lower time frame or you could sell below the most recent swing high.
TRIANGLES
- Below we are drawing a slightly smaller triangle because I am more of a short to intermediate swing trader:
- You would take the low of the triangle to the high as a means for expansion once it breaks through the top of the triangle.
- An ascending triangle is a continuation pattern.
- In this case you would want to be in a buy program.
- Every time there is a buying situation at the pip range of the base to the top of the triangle, you can place the projection on the low of that buying opportunity:
- You can also scale out of your trade with all these different price objectives:
- You would also use the actual break of the top side of the triangle:
- We can now see that there are many implied support & resistance levels based on these projections:
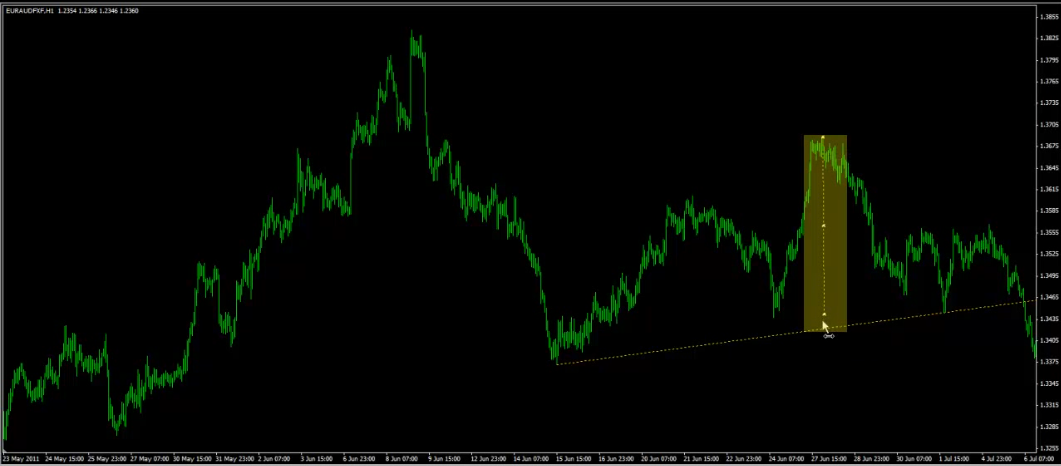
BULL FLAG CONTINUATION
- To get a swing projection for a bull flag, take the flag pole and add it to the low of the flag: ,
- You can also add it to the breakout level giving yourself a little higher price level to aim for:
- Always look to the left and keep other support & resistance in mind. In the above example, you would want to take profits at the highs on the left of the chart.
- Reverse this concept for a bear flag continuation pattern.
COIL EXPANSIONS
This example is on the 1 hour chart:
- Once price gets to the very small part of the coil, that should be a red flag that there is going to be a large expansion of price one way or the other. Use higher time frame analysis to get in sync.
- Coils by nature, are just a volatility pattern. They signify an increase in volatility that could translate to a lower or higher move of significance.
- The basis behind this whole pattern is that large ranges come after small ranges.
- To get the swing projection, draw a line across equivalent sides of the triangle like so:
TURTLE SOUP REVERSAL
- The turtles would sell when price made a 20 day high and would buy when price made a 20 day low on the daily chart. They had a lot of losses, but their wins were huge wins.
- Many times it is a false break when price breaks above or below the 20 day high or low. This is what the pattern is based upon.
- Once price forms a turtle pattern there are a lot of ways to compliment it, you can look for extreme reversal patterns such as pivot sell regions, judas swing, optimal trade entry, etc.
- You can also use turtle soup on an hourly chart because it is a universal pattern:

- In the example above, you can sell right into that resistance level or you can wait for the bounce and OTE.
- There are numerous OTE's in the example above to get short.

- The riptide reversal uses any significant high or low and not just the high or low from the last 20 periods.
ICT REFLECTION
- The ICT Reflection is a reversed optimal trade entry signal that is treated much like a judas swing, stop raid, riptide reversal, turtle soup, etc.:
- Many times you would trade right into the break of that low hoping that it is a raid on stops.
- For a reflection buy like in the image above you would place the OTE line on the low before the move up and the 0% retracement on the high and enter on the 100% retracement.
- On a 2% risk trade you would buy 1% at that 100 level as a stop raid and then you can wait for price to trade up and break market structure and buy the other 1% at the normal OTE entry.
OUTSIDE DAY WITH A DOWN CLOSE
- An outside day is any day that has a higher high and lower low than the day before.
- An outside day with a down close is a very bullish scenario. By itself it doesn't mean anything, but when it occurs at a time when we are oversold on the daily chart it does. The next day you would want to be looking for a Judas Swing down to get long. You could also look for optimal trade entry's in the kill zones to get long.
- The oversold indication on the daily chart is based on a 10 period Williams %R. 30 and 70 are the parameters on all momentum indicators for overbought and oversold.
INSIDE DAY
- An inside day is the opposite of an outside day. An inside day has a high that is lower than the high of the previous day and a low that is higher than the low of the previous day.
- Expansion is expected after there is an inside day. Get ready for a range expansion day once you see an inside day.
- Look for clear signs of manipulation to dial in on low risk, high reward setups intraday.