HIGH PROBABILITY PRICE PATTERNS
1. The Doji -
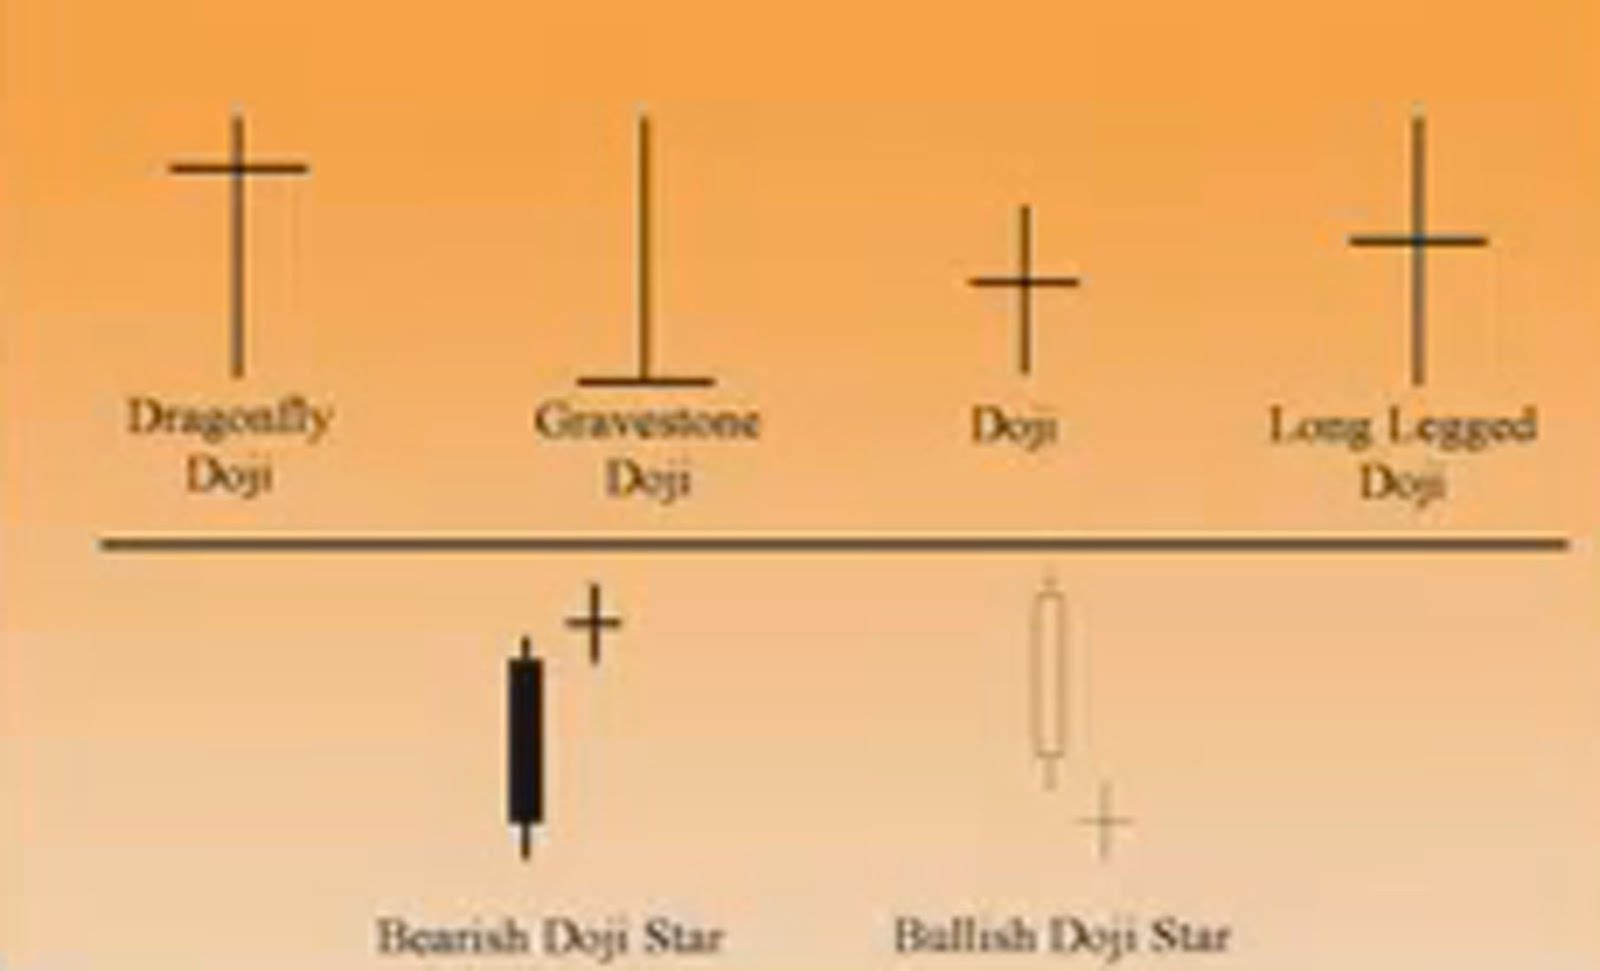
- Form when open and close are virtually equal. Doji alone is neutral. Bullish or bearish bias is based on preceding price action and future confirmation. Best used as confirmation of anticipated action, changes in direction.
2. The Hammer aka Pinbar -
- Form when price moves significantly lower after the open, but rallies to close well above the intraday low. Works in the opposite direction (bullish and bearish). Ideally like seeing these patterns at OTE or at key Support & Resistance Levels.
3. The Tweezer Low -
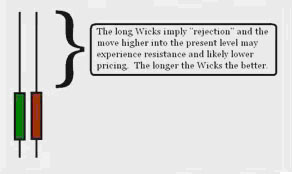
- Looks like consecutive Bullish Pinbars. Indicates that price held twice at the exact same level. Sellers not able to push price lower. The longer the wicks the better. Preference is to see the pattern at 4-Hour and 1-Hour charts at higher time frame S&R levels. If accompanies SMT Divergence, look to trade maximum risk exposure!

4. The Tweezer High -
- Looks like consecutive Bearish Pinbars. Indicates that price held twice at the exact same level. Buyers not able to push price higher. The longer the wicks the better. Preference is to see the pattern at 4-Hour and 1-Hour charts at higher time frame S&R levels. If accompanies SMT Divergence, look to trade maximum risk exposure!
5. Railroad Tracks -
- Two candlesticks with smaller wicks for highs/lows where the preceding candle's body matches that of the current candle's body in the opposite direction. Look for these at key levels to signify an engineered reversal. Very strong pattern.

6. Head & Shoulders Top Formation - Selling Pattern
- Typically occurs at intermediate or long-term high.
- Price objective from highest high of head to the lows at the neckline. Measure from high to the neckline and price objective would be that distance extending below the neckline.
- Selling Pattern.

7. Three Indians Climax Reversal Pattern
- Three progressively higher price slope highs reaching a top near an area of resistance. This would be a sell pattern as we'd reasonably expect price to fall. Look for OTE at a lower time frame.
- Selling Pattern.

8. Triangles & How ICT Trades Them
- Note a key resistance level where you find consolidation and support/resistance. Plot a general trend-line from low point to its intersection with the key resistance level. Measure from low up to the resistance level.
- Use the widest portion of the triangle and add that pip range to the low point dips along the trend line. Not each level as it progresses and these levels would be where you'd expect take profit points in the future during a buy program.
9. Inverted Head & Shoulders Bottom Formation
- Typically occurs at intermediate or long-term low.
- Price objective from lowest low of inverted head to the highs at the inverted neckline. Measure from low to the inverted neckline and price objective would be that distance extending above from the inverted neckline.
- Buying Pattern
10. Bull Flag Continuation Pattern -
- Look for the flag pole which would be a sharp price run up followed by descending range of price between channel. Price objective would be done by getting the pip range from low to high and adding that distance to the lowest low of the flag and to the breakout of the flag. There would be a reasonable expectation that price will appreciate to meet those levels.

11. Bear Flag Continuation Pattern -
- Look for the flag pole which would be a sharp price run down followed by ascending price range/channel. Price objective would be done by getting the pip range from high to low and adding that distance to the highest high of the flag and to the breakout lower of the flag. There would be a reasonable expectation that price will depreciate to meet those levels.

12. Coil Expansion Pattern
- Draw trend-line of lower highs and trend-line of higher low to a point where they look to intersect. As price approaches the intersection, we'd expect price to range higher or lower from that point.
- Use higher time frame analysis to get in sync and anticipate which direction price will due to directional bias. If pattern occurs at key support level, anticipate price to range higher.
- Measure range from the low to the touch point of the upper trend line of lower highs above it. Add the range to the upper or lower trend line to identify a price objective once price begins to range out of the coil.

13. Turtle Soup Reversal Pattern -
- Turtle Soup is when price takes out stops beyond an old high or low and immediately reverses direction
- Identify the lowest low and highest high in the last 20 periods/candlesticks.
- Go long at the time price goes below the lowest low in the previous 20 periods. This is done on the notion that the price move below is a false break.
- Go short at the time price goes above the highest high in the previous 20 periods. This is done on the notion that the price move above is a false break.
14. Riptide Reversal -
- Any significant high or low broken/rejected over any period, number of candles should move in the opposite direction after broken.
15. Outside Day with Down Close
- Pattern where second candle has a higher high and lower low than the period before with a down close. Bullish scenario when it occurs at an oversold period using Williams %R.
- Get long at the following bar using 30 and 70 levels for the indicator to determine overbought/oversold and 10 period.

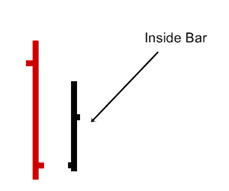
16. Inside Day -
- Pattern when the second candle has a higher low and a lower high than the previous day. Upon the close of the candle, it signifies a trending day or large range expansion day to follow.